How the Data Works
ABIDE isn't just a folder of JPEGs. It's high-dimensional 4D functional imaging data. Understanding the pipeline is critical for building models.
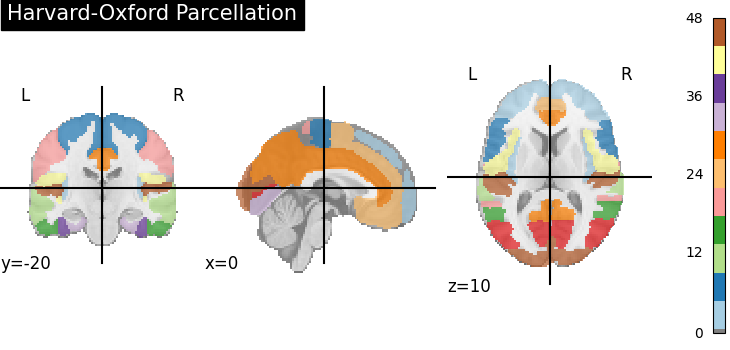 Step 1: Parcellation
Region of Interest (ROI) Extraction
We map the 4D brain volume to an atlas (like Harvard-Oxford or AAL) to segment the brain into distinct functional regions.
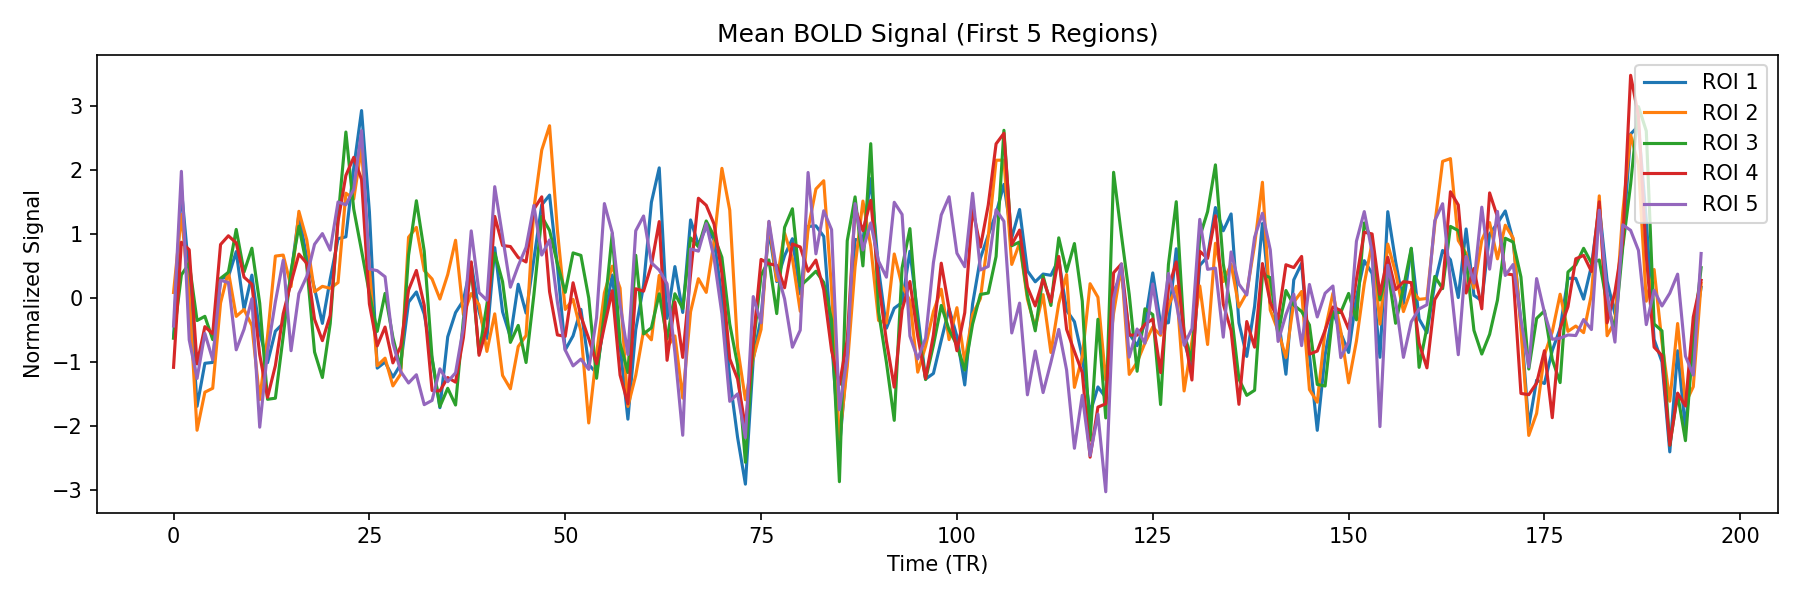 Step 2: Time Series
BOLD Signal Extraction
For each ROI, we extract the mean BOLD signal over time. This raw signal (shown above) represents neural activity fluctuations.
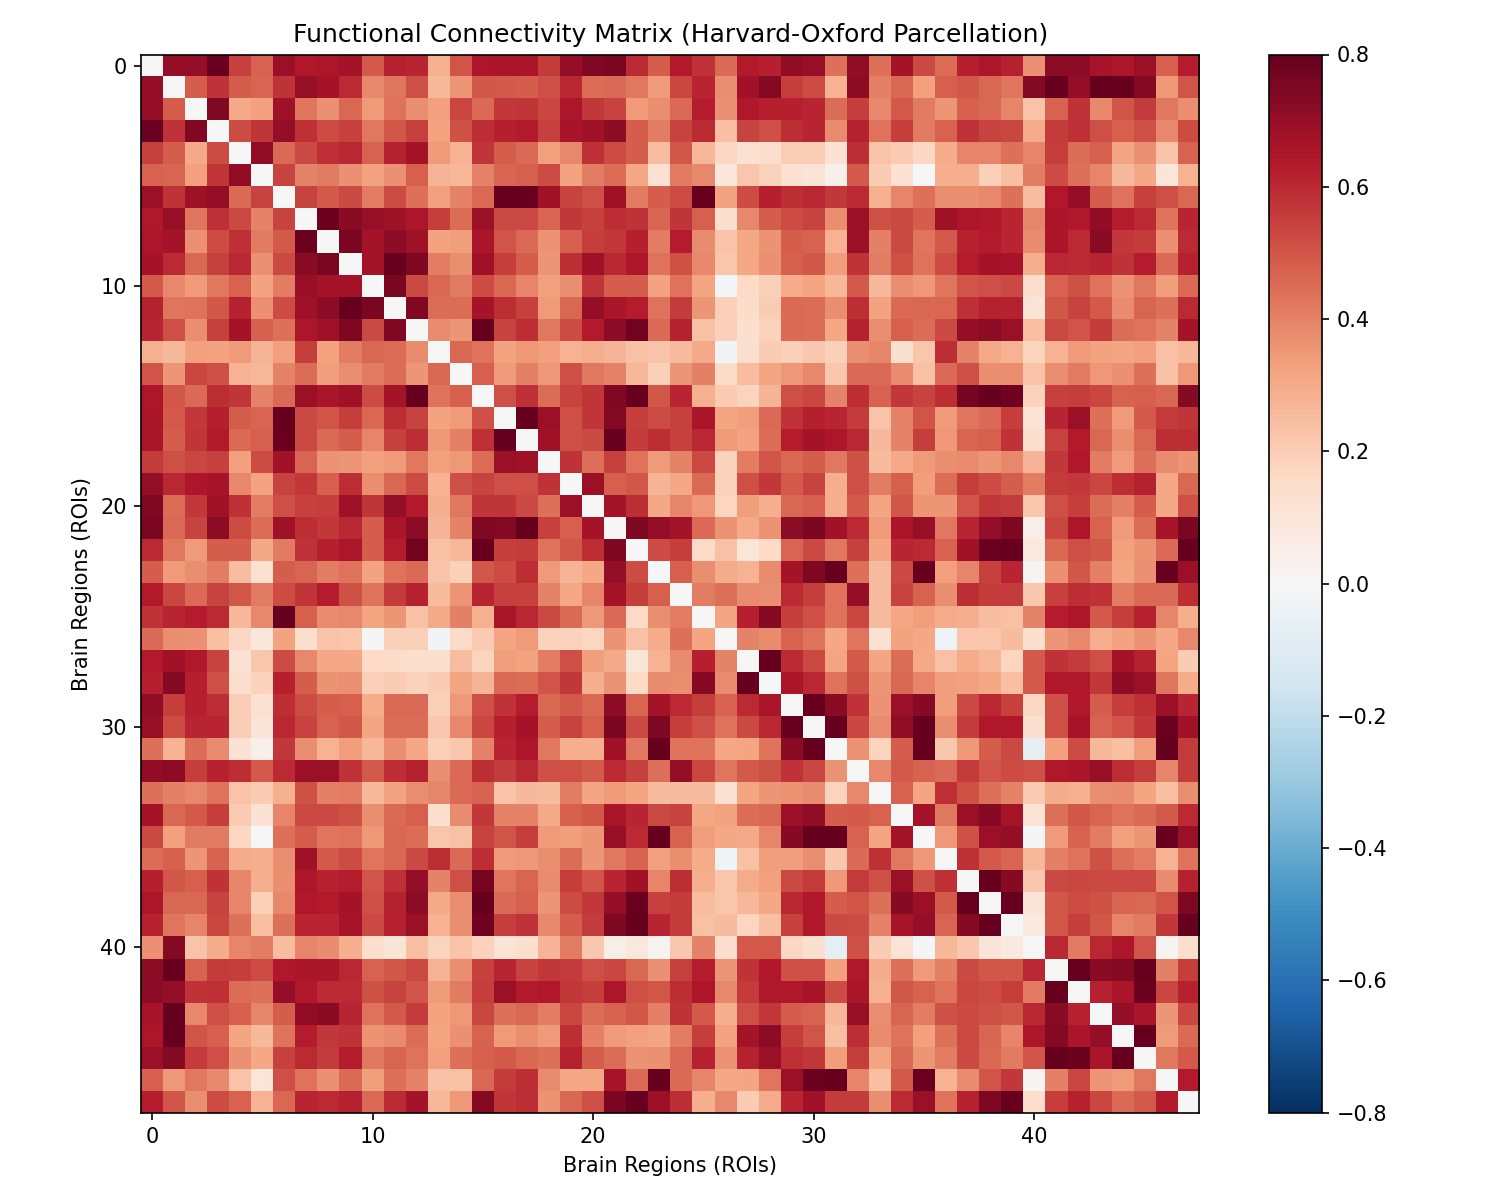 Step 3: Functional Graph
Functional Connectivity
We compute the correlation between every pair of regions. This matrix captures the "functional wiring" of the brain—the key to diagnosing ASD.
State of the Art Results
Comparing model performance on the standardized ABIDE I & II datasets. Note that the top result (Plymouth DL) was evaluated on a subset of participants.
| Model Rank | ABIDE I Acc | ABIDE I AUC | ABIDE II Acc | ABIDE II AUC | Modality | Eval Strategy |
|---|---|---|---|---|---|---|
#1 MAACNN Research | 75.1% | - | 72.9% | - | fMRICNN | k-fold |
#2 Plymouth DL Model Research | 98.0% | - | - | - | fMRIDeep Learning with XAI | k-fold |
#3 MCBERT Research | 93.4% | - | - | - | fMRI + PhenotypicMulti-modal CNN-BERT | LOSO |
#4 AE-FCN Research | 85.0% | - | - | - | fMRI + sMRIAutoencoder + Fully Connected Network | 10-fold |
#5 Multi-Atlas DNN Research | 78.1% | - | - | - | fMRIDeep Neural Network | k-fold |
#6 ASD-SWNet Research | 76.5% | 81.00 | - | - | fMRIShared-weight CNN | 10-fold |
#7 AL-Negat Research | 74.7% | - | - | - | fMRIGraph Neural Network | k-fold |
#8 BrainGNN Research | 73.3% | - | - | - | fMRIGraph Neural Network | 10-fold |
#9 GCN Research | 72.2% | 78.00 | - | - | fMRIGraph Convolutional Network | k-fold |
#10 Multi-Task Transformer Research | 72.0% | - | - | - | fMRITransformer | k-fold |
#11 PHGCL-DDGFormer Research | 70.9% | - | - | - | fMRIGraph Transformer | k-fold |
#12 SVM with Connectivity Features Research | 70.1% | 77.00 | - | - | fMRISupport Vector Machine | 10-fold |
#13 Deep Learning (Heinsfeld) Research | 70.0% | - | - | - | fMRIDeep Neural Network | k-fold |
#14 MVS-GCN Research | 69.4% | 69.01 | - | - | fMRIMulti-view Site Graph Convolutional Network | LOSO |
#15 Abraham Connectomes Research | 67.0% | - | - | - | fMRIConnectome Analysis | k-fold |
#16 Random Forest Baseline | 63.0% | - | - | - | fMRIEnsemble (Trees) | k-fold |
#17 BrainGT Research | - | 78.70 | - | - | fMRIGraph Transformer | 10-fold |
#18 DeepASD Research | - | - | - | 93.00 | fMRI + SNPsAdversary-regularized GNN | 10-fold |
Why Graph Neural Networks (GNNs) Rule
The brain is fundamentally a network. Traditional CNNs struggle because functionally connected regions (like the default mode network) can be spatially distant.
GNNs excel by modeling ROIs as nodes and connectivity as edges. Recent models like BrainGT (Graph Transformer) and DeepASD (Adversarial GNN) capture subtle topological disruptions in ASD brains, such as hypo-connectivity in social networks, outperforming standard methods.
The "Messy" Reality of Benchmarking
Comparing results on ABIDE is notoriously difficult due to three factors:
- Data Leakage (Phenotypic Data): Some models (like MCBERT) use participant metadata (e.g., social responsiveness scores) during training. Since these scores are used for diagnosis, this can be considered "cheating" compared to pure imaging models.
- Evaluation Strategy: Results vary wildly between Leave-One-Site-Out (LOSO) (harder, better generalization) and random k-fold cross-validation (easier, potential site bias).
- Preprocessing: Different pipelines (CPAC vs DPARSF) and atlases yield different effective inputs. "SOTA" might just mean "better preprocessing."
Explainable AI: Where is Autism in the Brain?
High accuracy isn't enough for clinical adoption; doctors need to know why. Recent SOTA models like the Plymouth DL Model (2025) use Explainable AI (XAI) techniques like gradient-weighted class activation mapping (Grad-CAM) to visualize decision-making.
Interestingly, these models highlight the visual processing regions (e.g., calcarine sulcus, cuneus) as critical discriminators, suggesting that sensory processing differences may be as fundamental to ASD as social cognition deficits.
Critical Regions Identified by XAI
- Calcarine SulcusVisual Cortex
- CuneusVisual Processing
- Posterior CingulateDefault Mode Network
- Middle Frontal GyrusExecutive Control
The Datasets
ABIDE I
20121,112 resting-state fMRI datasets from 539 individuals with autism spectrum disorder (ASD) and 573 typically developing controls across 17 international sites. Multi-site neuroimaging data for autism classification and biomarker discovery.
ABIDE II
20171,114 datasets from 521 individuals with autism spectrum disorder (ASD) and 593 typically developing controls across 19 sites. Second large-scale release complementing ABIDE I with additional multi-site neuroimaging data.
Contribute to Medical AI
Have you achieved better results on ABIDE? Or benchmarked a new GNN architecture? Help the community by sharing your verified results.