From human Elo to a small TTS judge
The workflow starts with scarce but high-value human votes. Those votes train a small pairwise judge. The judge estimates win rates for models that have not yet been in the listening test. Bradley-Terry turns those win rates back into an Elo-like ranking, and the next human votes are used to re-check the machine estimates where they are uncertain or surprising.
A benchmark that can grow without pretending automation is truth
The claim is not that WavLM features replace listeners. The claim is narrower and more useful: a small judge can turn a few hundred pairwise votes into a map of likely winners, likely losers, and high-value comparisons that deserve fresh human attention. It starts from one atom — a blind A/B listening test, two voices reading the same line, a listener picking the one they would ship.
Human Elo
Blind same-prompt votes define the target: which clip a listener actually prefers.
Small Judge
A lightweight pairwise model learns preference probabilities from speech embeddings and acoustic deltas.
Predicted Elo
The judge scores new model pairs, then Bradley-Terry converts predicted win rates into an Elo-like scale.
Fresh Votes
New human comparisons are held out after training to test calibration and find hard cases.
What was trained
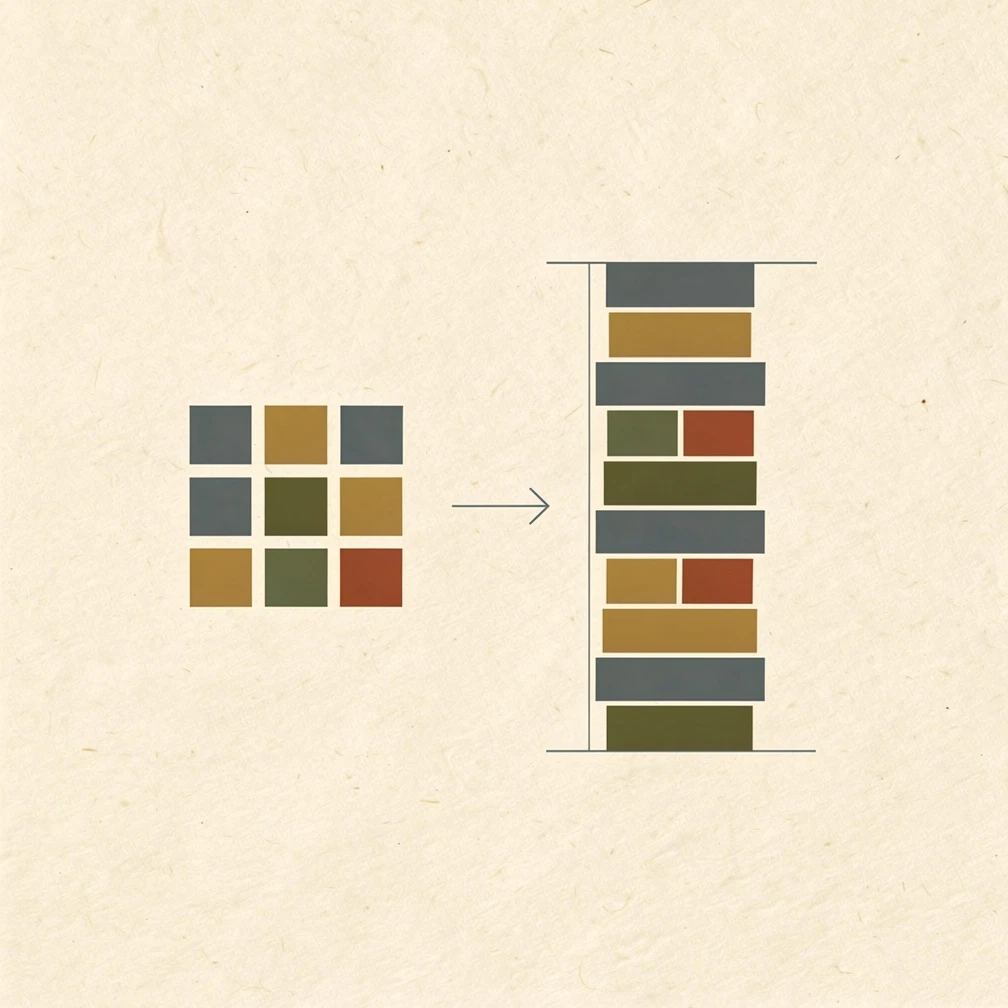
The unit of prediction is a pair, not a voice in isolation. Every vote becomes two training rows: the observed winner over loser and the mirrored loser over winner. That makes the model learn a probability surface for comparisons, which is the right shape for Elo and Bradley-Terry.
Human pairs
Blind same-prompt A/B votes
Feature bank
WavLM pooled vectors + acoustic deltas
Pair model
P(A beats B | features)
Tournament
Predicted win matrix
BT / Elo
Ratings and uncertainty queue
Embedding delta, duration delta, loudness delta, and spectral deltas for clips on the same prompt.
A calibrated logistic score: the model estimates the chance that A wins the human vote.
Predicted win rates are solved into a Bradley-Terry scale and displayed as Elo-like points.
How a vote becomes a score
The full path from two audio clips to one rating — a few hundred human votes distilled into one number per voice, then used to score models that were never in the listening test. The only learned step is the logistic model in the middle; everything around it is fixed signal processing and a closed-form rating fit. That is deliberate — a small, legible model is easier to trust and recalibrate than an end-to-end black box.
Same prompt, A and B16 kHz mono, loudness-matched to −21 LUFS
microsoft/wavlm-base-plusMean-pooled hidden states → 768-dim embedding per clip
8 hand featuresDuration, RMS, peak, ZCR, spectral centroid/bandwidth/flatness, silence
A minus BConcatenated embedding & acoustic differences → 776-dim
P(A beats B)Trained on 147 human votes, each mirrored → 294 ordered pairs
Win matrix → ratingPredicted pairwise wins fit to a 1500-centered Elo scale
Which layer? — a pitfall we tested
A subtle but real trap: self-supervised speech models like WavLM specialise by depth. Middle layers (~6–9) encode speaker identity, timbre, and prosody; the top layers drift toward phonetic content. Reaching for the last layer for every task is a common mistake that can pull a metric away from what listeners actually perceive. So we did not assume — we rebuilt the judge on every transformer layer and measured held-out AUC.
wavlm-base-plus-sv x-vector model, which learns its own weighting across layers. With only 147 votes this sweep is provisional; a timbre- or prosody-specific judge should re-run it and will likely land mid-stack.Embedding model into Elo
The classifier is trained on ordered pairs: winner clip minus loser clip. After fitting the preference model, every available model pair is scored across shared prompts. Those predicted win probabilities are converted into a Bradley-Terry rating scale centered around 1500. Striped rows are external Replicate models scored by the judge, not direct human-vote Elo rows.
75% ROC AUC
The validation split withholds prompt groups, which is stricter than randomly splitting votes. Accuracy is 65%, with uneven folds because some prompt families are sparse.
Calibration: a predicted 80% should win 80% of the time
Accuracy and AUC only ask whether the judge picks the right winner. A benchmark needs more — when it says “80% chance A wins,” A should actually win about 80% of the time. We test this directly: take every out-of-fold prediction from the leave-prompt-group-out cross-validation, bin by predicted probability, and compare each bin's claim against what really happened.
Where the model thinks pairwise edges are strong
Each cell is the predicted chance that the row voice beats the column voice. Green favors the row; red favors the column. The diagonal is 50. Sparse support still matters: this matrix is useful for prioritizing new listening tests, not for declaring a final voice leaderboard.
Use the judge to triage open TTS models
This is the first practical use of the preference model: render the same prompts with open-source or open-weight TTS systems, embed the clips, predict pairwise win rates against the current field, then convert those wins into a provisional Elo. The estimate is a screening tool, not a final benchmark. The current pass covers ten open candidate conditions, including fresh additions — Orpheus 3B (Llama-based), Supertonic 3 (a 99M-parameter on-device model), and Sesame's CSM-1B — so the page can show both model quality and voice-condition sensitivity.
Top current estimate, but includes a default study voice condition.
Resemble Chatterbox GitHubBest clean male-voice open-source estimate in this batch.
Resemble Chatterbox GitHubStrong open model candidate; should get more same-voice prompt coverage.
Qwen3-TTS technical reportGood local voice-cloning baseline, but not a permissive commercial OSS license.
Coqui XTTS v2 model releaseSmall, cheap, permissive baseline; quality trails larger expressive models here.
Kokoro Hugging Face model cardUseful fast baseline, but this judge predicts weak preference against richer voices.
Kokoro Hugging Face model cardLow estimate is likely a voice-condition artifact, not a model-family verdict.
Qwen3-TTS technical reportReplicate open-weight estimates
These model/voice conditions were not in the human Elo pool. We rendered 12 shared prompts through Replicate, embedded the WAVs, and asked the ranker to predict pairwise wins against the current field. Treat rows as model-plus-reference estimates: the same model can move materially when cloned from a different voice.
Preference is not intelligibility is not naturalness
A single Elo number hides real trade-offs. Borrowing the axes professional speech-evaluation services keep separate, we score every candidate on three independent measures: predicted human preference (the Elo judge), objective intelligibility (Whisper whisper-small.en word error rate against the known script), and predicted naturalness (UTMOS, the top VoiceMOS-2022 system, on a 1–5 MOS scale). The three rankings disagree — which is exactly why one score is not enough.
Every model has a shape
The same five axes, drawn as a profile per voice. A balanced pentagon is an all-rounder; a spiky one is a specialist. You can read each model's personality at a glance — where it reaches the rim and where it caves in.
No single objective metric predicts preference
If intelligibility or naturalness alone tracked human taste, you could retire listening tests. So we tested it directly: across the 15 voices that carry real human-vote Elo, how well does each objective metric correlate with the preference ranking? The answer is sobering — both are essentially flat. The most-preferred voice is not the most intelligible, and UTMOS saturates near the top so it cannot separate already-good models at all.
Intelligibility vs preference
ρ = +0.13Naturalness vs preference
ρ = +0.06The correlation matrix
Every axis against every other, as Spearman rank correlation across the 10 candidate voices. Blue is a positive relationship, red is negative, white is none. The diagonal is trivially 1. Two relationships jump out — and neither is about quality alone.
| Preference | Intelligibility | Naturalness | Pitch dynamism | Speaking rate | |
|---|---|---|---|---|---|
| Preference | 1 | +0.26 | +0.58 | +0.14 | -0.25 |
| Intelligibility | +0.26 | 1 | +0.36 | +0.42 | -0.66 |
| Naturalness | +0.58 | +0.36 | 1 | +0.06 | -0.06 |
| Pitch dynamism | +0.14 | +0.42 | +0.06 | 1 | -0.89 |
| Speaking rate | -0.25 | -0.66 | -0.06 | -0.89 | 1 |
Speaker similarity and prosody
Two more axes a voice team cares about. Speaker similarity asks, for the cloned voices, how close the generated speaker is to the intended identity — cosine similarity of wavlm-base-plus-sv speaker embeddings against a target centroid built from the established study-pool Chatterbox-Turbo Andy and Qwen3-TTS Aiden voices. Preset voices have no clone target. Prosody is reported descriptively, not as a quality score: pitch dynamism (F0 standard deviation in semitones, a proxy for expressive intonation) and speaking rate.
Fifty years of trying to grade a voice
None of the choices on this page — pairwise votes, an Elo scale, a neural MOS proxy, word error rate as a guardrail — are arbitrary. They are the current end of a fifty-year argument about how you measure something as slippery as “does this synthetic voice sound good?” That argument is documented in the 2025 Interspeech tutorial Automatic Quality Assessment for Speech and Beyond by Wen-Chin Huang (Nagoya University), Erica Cooper (NICT), and Jiatong Shi (CMU)[1], and the survey it builds on[2]. The failures of each era are exactly why our stack looks the way it does.
intelligibility
First, just make it understandable
Early formant and diphone synthesizers sounded robotic, so the only question worth asking was whether a listener could make out the words at all — naturalness came later. Evaluation meant the Diagnostic Rhyme Test[3], the Modified Rhyme Test[4] (BAD · BACK · BAN · BASS · BAT · BATH), and transcription of semantically-unpredictable sentences[5] — lines like “The table walked through the blue truth” that you cannot guess from context, so the score reflects the acoustics, not the listener’s language model. Comprehension tests existed too, but they saturate the moment synthetic speech is merely understandable, so they never saw wide use.
naturalness
Then, make it sound human — and standardize
Unit-selection and HMM synthesis cleared the intelligibility bar, so the field pivoted to naturalness. The ITU codified subjective testing for voice-output devices in P.85[6], though its many rating scales proved redundant and saw little adoption. The lasting institution from this era is the Blizzard Challenge (2005–): a shared task with shared data and shared listening tests, still the strongest precedent for comparing TTS systems fairly and for releasing the listening-test results back to the community[7].
MOS becomes the default scorecardcrowdsourcing
Then, scale it — and discover it was leaky
Crowdsourcing opened listening tests to thousands of online raters: faster and cheaper, but with no control over the listening environment. Hence attention checks, qualification thresholds, and headphone-screening tests like Huggins pitch[8]. And as MOS became the universal unit of account, the critiques piled up — which is the next section.
cheap data, fragile numbersWhy a single 1–5 score stopped being enough
Mean Opinion Score — average a five-point rating over many listeners and clips — is still the most-reported number in TTS papers. It is also, by the field’s own admission, deeply flawed. The tutorial collects the indictment, and most of it traces back to a handful of papers worth knowing.
Nobody agrees what “naturalness” means
Listeners are asked to rate naturalness with no shared definition, so style, expectation, and instruction wording leak into the number[9].
Averaging throws away the distribution
A 3.5 from tight agreement and a 3.5 from a bimodal split are very different signals, and a mean cannot tell them apart[11].
You cannot compare across tests
A 4.1 in one paper and a 4.3 in another are not comparable — ratings are relative to the range of quality inside that test[11].
Too few listeners to be significant
Many published TTS evaluations simply do not run enough listeners to support the differences they claim[10].
The test design tilts the answer
Scale layout, label words, stimulus spacing, and a listener’s mood all bias the score — a whole taxonomy of affective, response-mapping, and interface effects[12].
Modern voices are all near the top
When every system scores 4.3–4.6, MOS saturates and stops separating them — the exact failure this page is built around.
Five ways to score a voice without a panel
Once you accept that human listening tests are slow, expensive, and hard to reproduce, the goal becomes an automatic stand-in. The tutorial organizes every objective metric by one question: what reference does it get to see? That single axis explains why our scorecard mixes the metric types it does — and what it is still missing.
Reference-free / single-ended
UTMOS · the WavLM preference judgeThe metric sees only the clip — no ground truth. This is the only setting available for a fresh TTS model with no paired recording. UTMOS[25] (naturalness) and our pairwise judge both live here.
Transcript as the reference
Whisper ASR → WERNo reference audio, but you have the script: run ASR and measure word error rate. This is how intelligibility is scored today — ASR-WER tracks human transcription error at ρ≈0.94[32].
Speaker-matched, not lexically matched
WavLM-ECAPA cosine similarityA recording of the target speaker saying something else. Cosine similarity of speaker embeddings is the standard speaker-similarity proxy — ρ≈0.85 for x-vectors[33], ρ≈0.75 for ECAPA[34].
Distributional, no per-clip pair
FAD · TTSDSCompare the distribution of a model’s output to a pool of natural speech in an embedding space — Fréchet Audio Distance[30] and the TTS-specific TTSDS[31]. We do not run this yet; it is the obvious next axis.
Intrusive / double-ended
MCD · PESQ · SpeechBERTScoreA lexically-matched ground-truth recording, compared frame by frame. Powerful when it exists (MCD[16], the telephony metric PESQ[17], the SSL-based SpeechBERTScore[29]) — but TTS rarely has a paired natural take.
The lineage of automatic MOS
The naturalness number on this page (UTMOS) is the current rung of a twenty-year ladder. Each rung fixed the previous one’s blind spot, and knowing the chain is the difference between treating UTMOS as a magic 1–5 box and knowing precisely where it breaks.
Telephony signal metrics
MCD[16], f0 RMSE, and PESQ[17] / P.563[18] — built for codecs and phone lines, borrowed by early TTS.
Hand-built features + ML
Decision trees and SVMs over prosodic, MFCC, and spectral features; correlations climbed past 0.9 on Blizzard data.
End-to-end neural
MOSNet[19] (CNN-BLSTM, open-sourced) and NISQA-TTS[20] learn the rating directly from the waveform.
Listener modeling
MBNet[21], LDNet[22], and DeePMOS[23] model individual raters, not just the average — quality is per-listener.
Why we collect votes, not ratings
The deepest point in the tutorial is also the simplest: MOS is not absolute, it is relative. A model trained with an L1 loss in “score space” pretends 4.2 is a fixed physical quantity, when in fact a listener only ever judges a clip against the others in front of them. Research that leans into that relativity — predicting a quality difference against a non-matching reference, as in NORESQA[35] — generalizes better than raw score regression.
Pairwise preference takes the idea to its conclusion: ask only “which of these two is better?” Preference scores can be compared across listening tests, need fewer samples for a significant result, and can be made cheap with online/active learning that stops spending votes on pairs whose winner is already obvious[13]. Learning directly from preference data has been shown to generalize better than fitting the raw scores[36]. That chain — relative judgments → pairwise tests → active sampling → a Bradley-Terry / Elo scale — is the entire spine of this page. It is the field’s recommendation, not a shortcut.
Where these scores sit in the ITU framework
Subjective speech evaluation has formal standards. Mapping each axis onto them keeps the method honest and makes clear what is measured, on what scale, and what is still missing.
Comparative / CMOS
blind A/B → Bradley-Terry → EloListeners pick the better of two same-prompt clips. This is a comparative test — the family behind the ITU-T P.800 comparison-category (CMOS) rating — aggregated with Bradley-Terry into a 1500-centered Elo. Comparative tests resolve small differences that absolute rating blurs.
ACR MOS · ITU-T P.800 / P.808
UTMOS neural predictorAbsolute Category Rating asks a listener to score one clip from 1 (bad) to 5 (excellent); the average is MOS. UTMOS[25] is trained to predict that human ACR score, so it is a no-listener proxy for P.800[14] (lab) and P.808 (crowdsourced) naturalness.
Objective WER
Whisper ASR + jiwerNot an ITU subjective test: we transcribe each clip and measure word error rate against the script. It catches the failure mode naturalness scores miss — a fluent clip that mangles a number, URL, or email.
How MUSHRA works
MUSHRA — MUltiple Stimuli with Hidden Reference and Anchor (ITU-R BS.1534) — is the most discriminating listening test, built to separate systems that are all already good. Rather than rating one clip in isolation, the listener sees every version of the same passage on a single screen and scores each on a continuous 0–100 scale, split into five quality bands. Crucially, two of the clips on that screen are traps.
Because all versions are heard side by side, MUSHRA resolves differences far smaller than absolute MOS can, and a single trained panel of ~15–20 listeners yields tight confidence intervals. The cost is exactly that: screened, trained listeners and careful session design. That is why our page leans on Elo + UTMOS + WER as the cheap, always-on approximation — and flags MUSHRA as the gold standard to reach for when two voices are too close to call.
Every term, explained
This page leans on a lot of acronyms — error rates, opinion scores, embeddings, rating systems. Here is each one in plain language, with its own picture: what it measures, how it is computed, the scale it lives on, and where it shows up in this study.
Run a clip through a speech recognizer, then compare the transcript to the script the model was supposed to read. WER counts the edits needed to fix it — substitutions, insertions, and deletions — divided by the number of reference words. It is the standard objective measure of intelligibility: did the words actually survive the trip through synthesis? We normalize both sides with the Whisper text normalizer first, so spoken “ninety-eight thousand” and written “$98,750” are treated as the same.
0% is perfect; 50% means half the words are wrong. On this page F5-TTS hits ~31% on structured text.
The oldest and most common subjective test, standardized in ITU-T P.800. A listener hears one clip in isolation and rates it on a five-point scale: 5 excellent, 4 good, 3 fair, 2 poor, 1 bad. Average those ratings across many listeners and clips and you get the Mean Opinion Score. Because it rates clips independently it is simple to run, but it blurs small differences — two great voices both land near 4.5.
P.808 is the crowdsourced variant. UTMOS predicts this 1–5 score with no human in the loop.
Instead of rating one clip alone, the listener hears two and judges which is better and by how much, usually on a −3 to +3 scale. Comparative tests resolve differences that absolute rating misses, because the brain is far better at “A is slightly better than B” than at pinning an absolute number on a single clip. Our blind A/B vote is the binary version: just pick the winner, no magnitude.
Podonos’ head-to-head slider is a CMOS readout; our Elo aggregates thousands of these binary calls.
Multiple Stimuli with Hidden Reference and Anchor — the most discriminating subjective protocol. The listener rates several clips at once on a continuous 0–100 scale, while a known high-quality reference and a deliberately degraded low anchor are hidden among them to calibrate the scale and catch inattentive raters. It needs trained listeners and is expensive, which is why it is reserved for fine-grained ranking of already-good systems.
This is the gold standard our cheap Elo + UTMOS + WER stack approximates at near-zero cost.

A rating system borrowed from chess. Everyone starts at 1500; after each match the winner takes points from the loser, and the amount depends on how surprising the result was — beating a much higher-rated voice earns more. Over many comparisons the ratings settle into a ranking. The scale is interpretable: a 400-point gap implies the higher voice should win about 10 times out of 11.
On the leaderboard, Chatterbox Turbo sits near 1770 and the weakest voice near 1110.
A statistical model that takes a whole table of pairwise win probabilities and solves for one strength number per competitor that best explains them. Where Elo updates incrementally one match at a time, Bradley–Terry fits the entire set of comparisons at once, which is more stable when data is sparse. We use it to convert the judge’s predicted win matrix into the 1500-centered scale you see.
It is the math that lets a few hundred votes produce a coherent full ranking.
A large self-supervised transformer from Microsoft, trained on huge amounts of unlabeled audio to predict masked speech. The payoff is that its internal layers turn any clip into a dense vector that already encodes speaker identity, prosody, accent, and recording quality — without anyone labeling those things. The preference judge reads a 768-dimensional WavLM vector per clip as its main feature.
We use microsoft/wavlm-base-plus, mean-pooled across time into one vector.

A fixed-length fingerprint of who is speaking, designed so that two clips of the same person land close together regardless of what words are said. Speaker-verification models produce them, and the cosine similarity between two x-vectors is a number from 0 to 1 measuring how much two voices sound like the same identity. For cloned voices it answers: did the model actually capture the target speaker?
We compare each clone against an Andy/Aiden centroid; Dia drifts most at ~0.82.
A neural network that listens to a clip and predicts what MOS score human raters would give it, trained on large banks of human-rated audio. utmos22_strong was the top system in the VoiceMOS 2022 challenge. It is a free, instant stand-in for a naturalness panel — but, as this page shows, it saturates near the top, so it cannot separate two already-excellent voices.
On the candidate field it ranges 3.9 (Dia) to 4.5 (Spark-TTS) on the 1–5 scale.
Loudness Units relative to Full Scale, the EBU R128 standard for perceived loudness — the same measure streaming services use to keep tracks at an even volume. It models how loud audio actually sounds to a person, not just its peak amplitude. We normalize every clip to −21 LUFS before scoring so the judge compares timbre and delivery, not which clip happens to be louder.
Normalizing collapsed the field’s loudness spread from ±2.9 to ±0.3 LUFS.

A measure of whether two rankings agree, from −1 (perfectly reversed) through 0 (unrelated) to +1 (identical order). Unlike Pearson correlation it only cares about order, not exact values, so it is robust to odd scales and outliers. We use it to ask the central question: does any objective metric rank voices the same way humans do?
Intelligibility vs preference came out at ρ = 0.13 — essentially no relationship.
A statistical trap: correlation needs spread to detect. When every model in a comparison is already excellent, each metric’s values bunch into a narrow band, and even a real underlying relationship collapses toward zero. The flat correlations on the study field are partly this effect — and noticing it is itself the finding, because it explains why off-the-shelf metrics fail exactly where you most need them: separating the best from the very best.
UTMOS spanning only 4.1–4.5 across all 15 study voices is restricted range in action.
Where models break: structured text vs natural prose
Overall Elo hides where a model actually struggles. We split the shared prompts into symbol-heavy structured text (numbers, URLs, emails, dates, addresses, finance, acronyms) and natural prose (plain, entity, legal, medical, support), then asked the judge for each candidate's win rate against the field within each bucket. Almost every model is weaker on structured text — the input that stresses normalization and grapheme-to-phoneme handling rather than voice quality.
Which content type breaks which model
The bucket view averages a lot away. Here is every model against all twelve content types, coloured by word error rate. The structured columns (left) light up red almost everywhere; natural prose (right) stays green. Numbers, URLs, and emails are where intelligibility goes to die.
| Model | Acronyms | Addresses | Dates | Emails | Finance | Numbers | URLs | Names | Legal | Medical | Plain prose | Support | All |
|---|---|---|---|---|---|---|---|---|---|---|---|---|---|
| Orpheus 3BDan (preset) | 11 | 18 | 17 | 18 | 0 | 14 | 25 | 0 | 0 | 0 | 0 | 0 | 9 |
| Supertonic 3M1 (preset) | 11 | 0 | 17 | 27 | 18 | 0 | 25 | 17 | 0 | 0 | 0 | 0 | 10 |
| Zonos v0.1Aiden clone | 11 | 0 | 0 | 27 | 18 | 0 | 42 | 0 | 17 | 0 | 0 | 0 | 10 |
| Spark-TTSAiden clone | 0 | 0 | 0 | 27 | 0 | 0 | 50 | 0 | 0 | 40 | 0 | 0 | 10 |
| Spark-TTSAndy clone | 0 | 0 | 17 | 27 | 0 | 14 | 50 | 0 | 0 | 10 | 0 | 0 | 10 |
| CSM-1BSpeaker 0 | 33 | 27 | 0 | 27 | 0 | 43 | 17 | 0 | 0 | 0 | 0 | 0 | 12 |
| Zonos v0.1Andy clone | 11 | 27 | 17 | 27 | 27 | 14 | 17 | 0 | 25 | 0 | 0 | 0 | 14 |
| DiaAndy clone | 11 | 0 | 17 | 100 | 9 | 14 | 25 | 0 | 0 | 10 | 0 | 0 | 16 |
| F5-TTSAndy clone | 67 | 9 | 17 | 27 | 18 | 57 | 25 | 0 | 0 | 10 | 0 | 0 | 19 |
| F5-TTSAiden clone | 67 | 36 | 17 | 27 | 18 | 43 | 25 | 0 | 0 | 20 | 0 | 0 | 21 |
What the model actually said
WER is abstract until you read the transcripts. These are real clips, transcribed by Whisper: the script the model was given versus what came out. Struck-through words were dropped; highlighted words are wrong or hallucinated. Smooth on prose, shattered on symbols — the most spectacular failure is a model that abandoned the prompt entirely and recited a YouTube outro.
the escalation alias is support dash priority at codesota dot com
i will see you next time
the api uses oauth jwt tls and http 2
the api uses yogeo thtp
the confirmation code is 739 184 552
the comfort code is 7398048
visit status dot example dot com slash incidents slash april dash report
visit status example com incidence april report
record the dosage as 25 milligrams twice daily with food
it will print the dosage as 25 mg twice daily with food
ship the replacement unit to 742 evergreen terrace springfield oregon 97403
ship the replacement unit to 742 evergreen terry springfield oregon 97 4 3
Ask humans about these next
The best next comparisons are not the most famous models. They are the pairs where the model is near 50/50, where prompt support is thin, or where a voice-condition mismatch could be hiding in the data. This is no longer just a table: the live voting page now samples pairs by the same logic — after every vote it favors near-tied ratings and under-tested voices, so human attention flows to the comparisons that move the ranking most.
| Pair | Predicted split | Prompt support | Why it matters |
|---|---|---|---|
| Chatterbox Turbo / default study voice | 50 / 50 | 8 | Near-tie: high leverage for rank ordering. |
| Gradium TTS / Kent | 52 / 48 | 3 | Near-tie: high leverage for rank ordering. |
| ElevenLabs v3 / James | 52 / 48 | 12 | Near-tie: high leverage for rank ordering. |
| Gradium TTS / Kent | 47 / 53 | 15 | Near-tie: high leverage for rank ordering. |
| Kokoro v1.0 / am_michael | 46 / 54 | 4 | Sparse prompt overlap: add votes before trusting the edge. |
| Gradium TTS / Kent | 46 / 54 | 7 | Stable enough to track, still useful for calibration. |
| Speech-02 HD / default study voice | 46 / 54 | 5 | Sparse prompt overlap: add votes before trusting the edge. |
| ElevenLabs v3 / default study voice | 55 / 45 | 4 | Sparse prompt overlap: add votes before trusting the edge. |
| Gradium TTS / Kent | 45 / 55 | 6 | Stable enough to track, still useful for calibration. |
| Gradium TTS / Kent | 55 / 45 | 11 | Stable enough to track, still useful for calibration. |
The hard part is generalization, and the fix is a moving baseline
Automatic MOS prediction has its own benchmark series — the VoiceMOS Challenge (2022[41], 2023[42], 2024[43]) and now the AudioMOS Challenge 2025[44] — and its central lesson is blunt: the whole problem is generalization. A predictor that hits 0.939 system-level SRCC in-domain[41] can fall apart on a new TTS system, a new listening test, a new language, or a new distortion. In practice you should assume the next thing you score is out-of-domain.
That is precisely the “restricted range” caveat stamped on our correlation plots above: a judge trained on one field of strong commercial voices is an in-domain instrument, and we say so rather than pretend it is universal. The challenge organizers also make a point baked into CodeSOTA’s design — the baseline should be state-of-the-art. If your starter system is SOTA and a participant beats it, that is provable progress; a weak baseline just manufactures the illusion of it.
Evaluation that explains itself
A single number — even a perfectly calibrated one — does not tell a voice team what to fix. Two directions in the tutorial point past the scalar MOS, and both match where this page is already heading.
One model, several named axes
Instead of collapsing everything into “naturalness,” predict interpretable dimensions. NISQA[37] outputs noisiness, coloration, discontinuity, and loudness; Meta’s Audiobox Aesthetics[40] outputs production quality, production complexity, content enjoyment, and content usefulness. Our five axes plus per-vote factor tags (expressiveness · pacing · pronunciation · hallucinations) are the same instinct: a scorecard, not a score.
Language, not just numbers
The newest work asks an audio language model to describe the defect — “a distorted, electric-current quality from 1.5–2.0s” — localizing it in time and attributing a cause. QualiSpeech[38] and ALLD[39] are early steps toward evaluation that reads like a reviewer’s note. The tutorial calls this the ultimate goal; for a public benchmark it is the difference between a leaderboard and a diagnosis.
The toolkits the field actually runs on
None of this requires reinventing metrics. The community has converged on shared infrastructure, and our stack is deliberately assembled from the same parts so results stay comparable to published work.
MOS-Bench
Seven training sets and twelve test sets spanning TTS, voice conversion, singing, and distorted speech across five languages and 8–48 kHz — built specifically to measure the generalization a single listening test cannot.
SHEET
All-in-one recipes for speech MOS prediction — data prep, training, and off-the-shelf models via torch.hub / HuggingFace. The lineage from SSL-MOS[24] to UTMOS[25] ships here.
VERSA
Versatile Evaluation of Speech and Audio: ~90 metrics behind one interface, integrated into ESPnet and the CHiME challenges; Uni-VERSA predicts many at once for a ~100× speedup[1].
The useful claim is workflow, not final rank
Low-volume human preference data is too scarce for a universal voice judge. The stronger claim is that a lightweight model can turn a few hundred votes into a ranked map of uncertainty. WavLM embeddings capture speaker, prosody, and quality cues; simple acoustic features catch duration, loudness, and spectral shape; and Bradley-Terry turns model-level pair probabilities into a readable scale.
That breadth now spans five axes — preference (Elo), intelligibility (Whisper WER), naturalness (UTMOS), speaker similarity, and prosody — grounded in the ITU subjective-evaluation standards above, with a per-vote factor (expressiveness, pacing, pronunciation, hallucinations) recorded so wins can be attributed, not just counted. The roadmap below lays out what already ships, what is being built, and the longer bets — read against the history and taxonomy on this page.
Research goals: what ships, what’s next
This is a benchmark that grows without pretending automation is truth — so the goals are explicit. Each one is tagged by where it stands, and the open items are the field’s open items too, not just ours.
Five-axis scorecard
Preference (Elo via Bradley-Terry), intelligibility (Whisper WER), naturalness (UTMOS[25]), speaker similarity (WavLM-ECAPA cosine), and descriptive prosody — every axis runs on any new voice the moment it ships, at near-zero marginal cost.
Attributed wins, not just counts
The voting page records a per-vote factor — expressiveness · pacing · pronunciation · hallucinations — so a win can be traced to a cause. This is the multi-dimensional instinct (cf. NISQA[37], Audiobox Aesthetics[40]) applied to preference.
Active-learning vote queue
New comparisons are chosen by uncertainty sampling — near-tied or under-sampled pairs — rather than uniform random, the cheaper-preference-test recipe from the literature[13].
Fix the calibration
The reliability diagram above shows the judge is overconfident (a claimed 97% win lands nearer 77%). Next: a temperature-scaling pass, then a held-out set of fresh human votes collected after training to confirm the fix holds. Trust the ranking, not the literal probability — yet.
Report why a clip wins
Enough factor votes to attribute each win to a named cause at statistical strength — turning the scorecard from “which won” into “won on delivery, lost on a mangled number.”
Add the distributional axis
The non-matched-reference family missing from our five — Fréchet Audio Distance[30] and the TTS-specific TTSDS[31] — scoring a model by how close its output distribution sits to natural speech.
A trained prosody-MOS predictor
Prosody is currently descriptive (F0 dynamism, speaking rate), not a learned quality score. A prosody- specific judge should re-sweep SSL layers — quality lives in the last layer, but timbre and prosody peak mid-stack.
A MUSHRA human anchor
A screened-listener MUSHRA panel (ITU-R BS.1534[15]) as the gold-standard calibration that the cheap Elo + UTMOS + WER stack is approximating — the natural next step when two voices are too close to call.
Evaluation that explains itself
Localized, attributed defect descriptions in natural language — “electric-current distortion from 1.5–2.0s” — the audio-LLM direction of QualiSpeech[38] and ALLD[39]. The tutorial calls this the ultimate goal.
Generalize past the restricted range
Today’s judge is an in-domain instrument trained on one field of strong commercial voices. The open problem — and the whole point of the VoiceMOS Challenge series[41],[43] — is out-of-domain generalization to new systems, languages, and distortions.
Compete at VoiceMOS 2026
Skin in the game: an emotional-TTS MOS predictor for Track 2, extending the UTMOS lineage[25] with an emotion encoder. The best way to keep this page honest is to be scored on the same benchmark we cite.
Where this comes from
The history, taxonomy, and frontier on this page are drawn from the Interspeech 2025 tutorial Automatic Quality Assessment for Speech and Beyond by Wen-Chin Huang (Nagoya University), Erica Cooper (NICT), and Jiatong Shi (CMU)[1], and the survey it builds on, Cooper et al. (2024)[2]. The numbered references below back the specific claims throughout — each bracketed marker links here.